Short answer: the best free Hyperliquid liquidation map depends on what you need (all checked October 21, 2026):
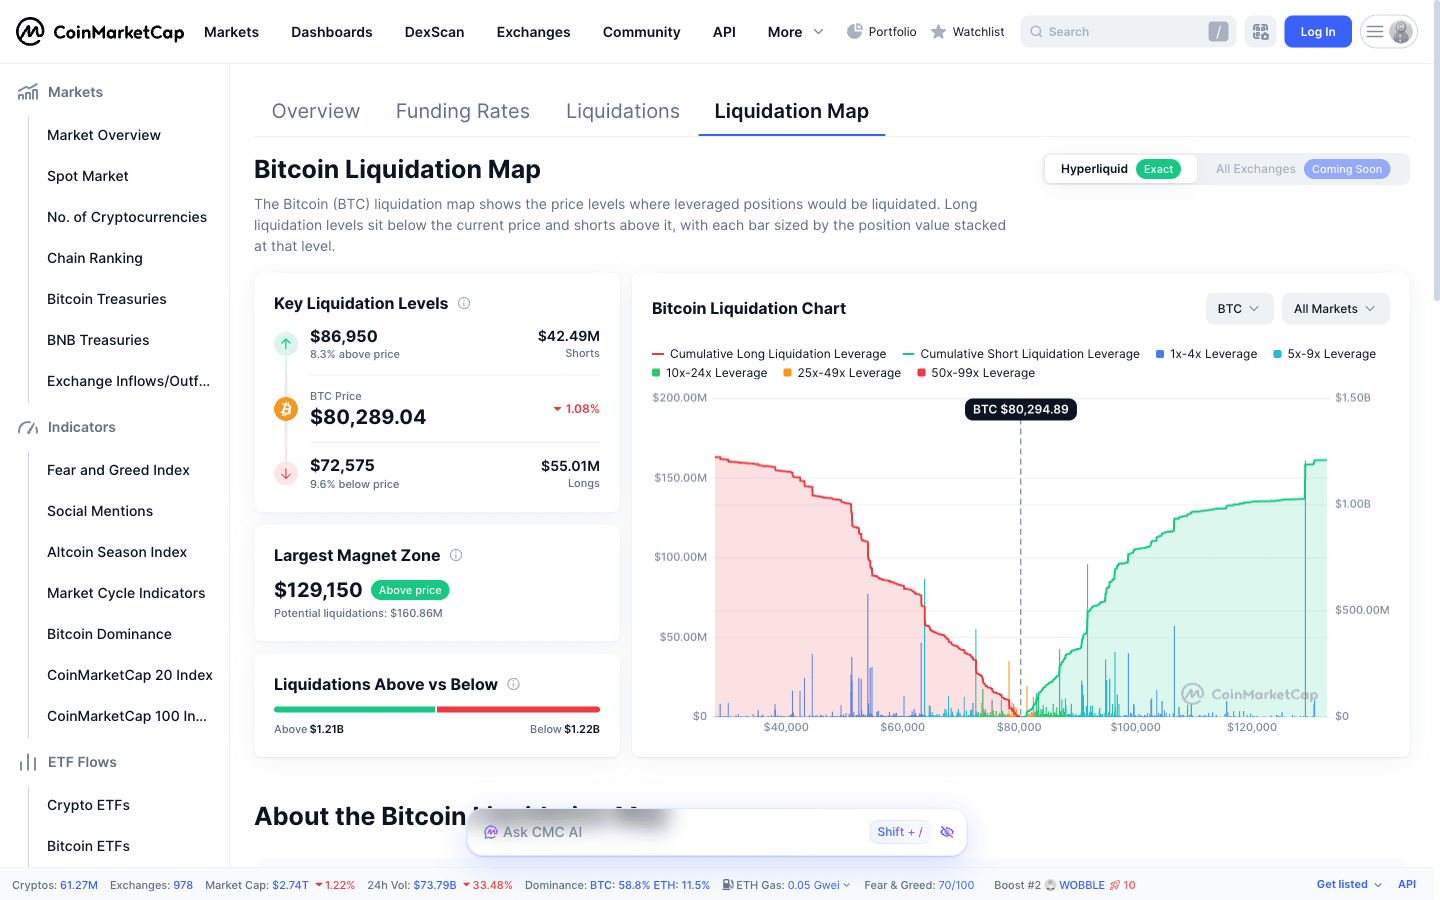
- Exact levels of every open position: the CoinMarketCap Liquidation Map, every native Hyperliquid perp, new data every 60 seconds.
- A heatmap over time: the CoinMarketCap Liquidation Heatmap (the same exact levels recorded about every 5 minutes) or HyperPerps for BTC, ETH, SOL and HYPE.
- Whales only: the CoinGlass Hyperliquid Liquidation Map (positions over $1M) or HyperTracker’s list of positions over $500,000 close to liquidation.
- What already got liquidated: Allium or HyperTracker (24-hour and 30-day totals from fills).
Every bar on these maps is a live Hyperliquid position with a public liquidation price. To open one and watch your own level live, you need a Hyperliquid account: join with code HOLYGRAIL first for 4% off your fees on the first $25M of volume.
Heatmaps for the HYPE token on Binance and Bybit are models, not Hyperliquid data. Liquidations fire at the mark price and hit the order book as market orders, 20% at a time for positions over 100,000 USDC. What a 2% or 5% move would liquidate right now is in the first table below; your own level comes from the Hyperliquid calculator.
1. Hyperliquid liquidations today: the heatmap near price and whale levels
Liquidation heatmap now: what a 2% or 5% move would liquidate
The table reads the free HyperPerps heatmap API, which rebuilds the liquidation clusters of about 21,000 Hyperliquid wallets every 5 minutes from their on-chain positions (market makers excluded), and this page re-reads it at every build. It answers the first question behind “Hyperliquid liquidations today”: how much would be force-closed if price moved a little from here.
| Coin | Price | Longs liquidated at −2% | at −5% | Shorts liquidated at +2% | at +5% | Largest cluster within 5% |
|---|---|---|---|---|---|---|
| BTC | $81,544 | $36.6M | $257.1M | $18.1M | $61.1M | $79,505 longs, $49.6M (−2.5%, 16 wallets) |
| ETH | $2,381 | $0.8M | $260.9M | $5.2M | $28.9M | $2,292 longs, $107.7M (−3.75%, 5 wallets) |
| HYPE | $79.42 | $1.0M | $12.6M | $0 | $0 | $76.64 longs, $2.8M (−3.5%, 8 wallets) |
| SOL | $104.02 | $0 | $24.3M | $0.5M | $1.4M | $98.81 longs, $21.3M (−5%, 2 wallets) |
Data as of October 15, 2026, 04:41 UTC (stored snapshot; the live API was unavailable at build time). Source: HyperPerps public heatmap API, BTC 2,763, ETH 1,698, HYPE 2,304, SOL 955 open positions analysed. Cumulative notional whose liquidation price sits within 2% and 5% of the price shown. Not a forecast: positions get re-margined or closed before price arrives.
At this reading the near-price risk is on the long side for BTC, ETH, HYPE, and SOL: a 5% drop would force out at least twice as much as a 5% rise. Clusters made of one or two wallets can be defended with more margin; the wallet count in the last column tells you whether a cluster is a crowd or one trader.
What already got liquidated
The second meaning of “Hyperliquid liquidations” is the total that already fired. Hyperliquid has no market-wide liquidation stream or endpoint in its API: a liquidation is flagged in the liquidated account’s own fills, and the only complete record is the node fill archive on S3 (official WebSocket and info docs, checked October 21, 2026), so exchange-wide totals come from third parties that collect every account’s fills. At about 07:10 UTC on October 21, 2026, Allium and HyperTracker showed the same 24-hour figure: $44.1M of notional liquidated across 3,823 traders (4,519 positions), $38.7M of it shorts caught by the bounce, and the largest single liquidation a $7.59M ETH position. Allium’s median liquidation that day was about $300, so the crowd that actually gets liquidated is mostly small accounts with high leverage, not the whale bars on a map. None of the whale accounts we tracked from October 15 was liquidated in the six days since (a userFillsByTime check of each found no liquidation fill): they added margin instead (below). For your own or any address’s liquidation history, and for the full archive, see Hyperliquid historical data API.
Whale liquidation levels (October 21, 2026 snapshot)
To show what sits under the map, we took the 500 largest active accounts on the official leaderboard (accounts that traded in the last 30 days) and the 439 dormant accounts among the 700 largest, queried each one’s positions at October 21, 2026 (07:00 UTC) and bucketed their liquidation prices. The 324 accounts with open perps held $6.65B of notional against Hyperliquid’s $11.60B of open interest at that moment, so this is the whale half of the map (HIP-3 markets not included; dormant accounts are marked). For live levels, use the tools below; this table is dated on purpose.
| Coin | Mark | Side | Liquidation band | Notional | Distance | Composition |
|---|---|---|---|---|---|---|
| BTC | $82,781 | Long | $74,000–75,000 | $66.6M | −10% | One 805 BTC long at 10x isolated |
| BTC | $82,781 | Long | $69,000–70,000 | $123.0M | −16% | One 1,236 BTC long at 12x cross ($9.0M of margin added on October 17) and one 250 BTC long at 25x cross |
| BTC | $82,781 | Long | $56,000–57,000 | $82.8M | −32% | One 1,000 BTC long at 40x cross (dormant account) |
| BTC | $82,781 | Long | $50,000–51,000 | $106.5M | −39% | One 1,000 BTC long at 3x cross (dormant account) and one 287 BTC long at 20x cross |
| BTC | $82,781 | Short | $91,000–92,000 | $59.7M | +10.5% | One 721 BTC short at 8x isolated |
| BTC | $82,781 | Short | $100,000–101,000 | $41.3M | +21% | One 498 BTC short at 25x cross |
| BTC | $82,781 | Short | $139,000–140,000 | $213.3M | +69% | One 2,516 BTC short at 5x cross (0xb83d…) plus one 60 BTC short |
| BTC | $82,781 | Short | $147,000–148,000 | $216.0M | +78% | One 2,609 BTC short at 5x cross (0x5b5d…) |
| ETH | $2,441 | Long | $2,200–2,250 | $214.3M | −8.9% | Two longs of 45,169 ETH (10x cross) and 41,590 ETH (9x cross), $8.0M of margin added on October 18, plus one 1,000 ETH isolated long |
| ETH | $2,441 | Long | $1,750–1,800 | $74.6M | −27% | One 30,282 ETH long at 20x cross (dormant account) |
| ETH | $2,441 | Long | $1,700–1,750 | $103.0M | −29% | Five longs of 7,000–11,000 ETH at 10x–25x cross |
| ETH | $2,441 | Long | $1,600–1,650 | $80.5M | −33% | Three longs of 11,000 ETH at 20x cross (dormant accounts) |
| ETH | $2,441 | Short | $3,750–3,800 | $36.0M | +55% | Three shorts at 25x cross |
| ETH | $2,441 | Short | $4,000–4,050 | $309.5M | +65% | One 106,350 ETH short at 5x cross (0x5b5d…) and one 20,437 ETH short at 25x |
| HYPE | $80.89 | Long | $70–72.5 | $111.6M | −12% | One 1,380,043 HYPE long at 5x cross (dormant account; $3.75M of margin added since October 15) |
| HYPE | $80.89 | Long | $42.5–45 | $79.7M | −46% | Five longs incl. 450,000 HYPE at 10x cross (dormant account) |
| HYPE | $80.89 | Short | $97.5–100 | $21.7M | +22% | One 268,299 HYPE short at 5x cross |
| HYPE | $80.89 | Short | $105–107.5 | $68.9M | +31% | Two shorts of 610,370 HYPE (5x) and 241,695 HYPE (10x) |
| SOL | $105.99 | Short | $130–135 | $12.1M | +25% | One 113,890 SOL short at 20x cross |
| SOL | $105.99 | Long | $65–70 | $58.3M | −36% | One 550,088 SOL long at 20x cross (dormant account) |
A selection, not a full ranking: the nearest bands on each side of every coin plus the largest farther out; some farther bands of similar size are left out. Bands are $1,000 wide for BTC, $50 for ETH, $2.50 for HYPE and $5 for SOL, and the row text names the largest positions in each band.
How much whale notional would liquidate within a given move (October 21, 2026):
| Coin | Longs within 5% | Shorts within 5% | Longs within 10% | Shorts within 10% | Longs within 20% | Shorts within 20% |
|---|---|---|---|---|---|---|
| BTC | $2M | $0 | $94M | $0 | $233M | $73M |
| ETH | $0 | $0 | $214M | $5M | $270M | $32M |
| HYPE | $0 | $0 | $1M | $0 | $115M | $0 |
| SOL | $0 | $0 | $0 | $0 | $4M | $0 |
What this snapshot says:
- Whales have stepped back from price. Within 5% of the mark the whale sample held almost nothing ($2M of BTC longs, none on ETH, HYPE or SOL), against $88M of BTC longs and $203M of ETH longs within 5% on October 15. At this reading the near-price risk is smaller traders, the HyperPerps table at the top, not whales.
- ETH still carries the nearest heavy weight. Two longs of 45,169 ETH (10x cross, liquidating near $2,234) and 41,590 ETH (9x cross, near $2,204), $214M between them, sit 8–10% under the mark. They are the two accounts Hyperliquid cut in 20% slices on October 8; both received margin again on October 18 and added size, which moved their levels $56 and $97 further from price.
- BTC: an isolated long at −10%, the big one at −16%. An 805 BTC isolated long at 10x liquidates near $74,780. The 12x cross long, now 1,236 BTC, moved from about $74,450 to $69,200 after $9.0M of USDC arrived on October 17. The nearest large short is still the 721 BTC isolated position near $91,700, 11% up.
- HYPE’s big level keeps sliding away. The dormant 1,380,043 HYPE long ($112M at 5x cross) liquidates near $71.68, 11% under the mark, after $3.75M of USDC arrived since October 15; the second transfer landed about 90 minutes before HYPE’s low of $76.02 on October 18. No whale short liquidates within 20%.
- SOL is quiet. No position in the whale sample liquidates within 10% of the SOL price; the nearest large bands are a 113,890 SOL short near $133 (+25%) and the dormant 550,088 SOL long near $67.94 (−36%).
- The biggest bars are the farthest. The two 5x cross books (addresses beginning 0x5b5d and 0xb83d) hold BTC shorts that liquidate near $139.6k and $147.9k and ETH shorts near $4,027 and $4,581, 65–88% away. They dominate any list sorted by size and barely matter for the next week.
What happened to the October 15 levels: none was reached, three were topped up
On October 15 the nearest heavy bands were BTC longs at 25x–40x between $77,900 and $79,400 ($88M), the two ETH longs near $2,301 and $2,290 that had been cut in 20% slices on October 8, the 12x BTC long near $74,450 and the dormant HYPE long near $74.56. None was reached: BTC’s low since then was $79,732 (October 15, 13:00 UTC), ETH’s $2,322.4 in the same hour and HYPE’s $76.02 (October 18), all from Hyperliquid’s hourly candles. The three BTC longs at 25x–40x are no longer in our sample (closed, cut or no longer among the largest accounts). The others were defended with fresh money before price got close. The address that funded the BTC and ETH whales in early October sent $9.0M to the BTC account on October 17; it then added 233 BTC and opened a 15,928 ETH long, and its BTC level moved from about $74,450 to $69,200. On October 18 the same address sent $3.5M and $4.5M to the two ETH accounts, which bought another 4,900 and 2,600 ETH; their levels moved to $2,234 and $2,204. The dormant HYPE long received $2.1M on October 15 and $1.65M on October 18, the second about 90 minutes before HYPE’s low, and its level slid from $74.56 to $71.68 without a single trade. The lesson from two snapshots: on October 8 the ETH whales were sliced before their money landed; this week the money landed first. A whale level is a moving target, so check the time on any map before trading toward it.
Hyperliquid Calculator — Liquidation price, margin, fees, hourly funding and PnL for any Hyperliquid perp, with the official formula and margin tiers. — Open the calculator →“Where would Hyperliquid positions get liquidated?”
You want the exact map of positions on the Hyperliquid exchange. Use CoinMarketCap, CoinGlass’s Hyperliquid map or HyperPerps (group A).
“Where are HYPE longs and shorts on Binance?”
You want a HYPE token heatmap. These are models of centralized-exchange leverage: CoinGlass, Coinfuty, Datawallet (group B).
“How much got liquidated on Hyperliquid today?”
You want liquidation history: what already fired, then Allium, the CoinGlass history heatmap or the API (section 5).
2. Hyperliquid liquidation map and liquidation heatmap tools compared (16 checked)
We opened all 16 tools on October 21, 2026, with curl and in a real browser for the ones that block scripts, noting what each shows, where the data comes from and what it costs; 15 were free. “Exact” means the levels are read from Hyperliquid’s on-chain positions; “Model” means they are estimated from open interest and assumed leverage. None of these links are affiliate links.
| Tool | What it shows | Data | Cost |
|---|---|---|---|
| A. Levels of open positions on the Hyperliquid exchange (exact, from the chain) | |||
| CoinMarketCap Liquidation Map | Current liquidation levels of every open position on every native Hyperliquid perp, per token or per market. Bars coloured by leverage band, key levels above and below, “Largest Magnet Zone”. No position-age filter. Refreshes every 60 seconds. | Exact | Free |
| CoinMarketCap Liquidation Heatmap (new, Sept 2026) | The same exact levels recorded over time: a new column roughly every 5 minutes, 24h or 1W view. Changing the range only zooms; the numbers do not change. | Exact, recorded | Free |
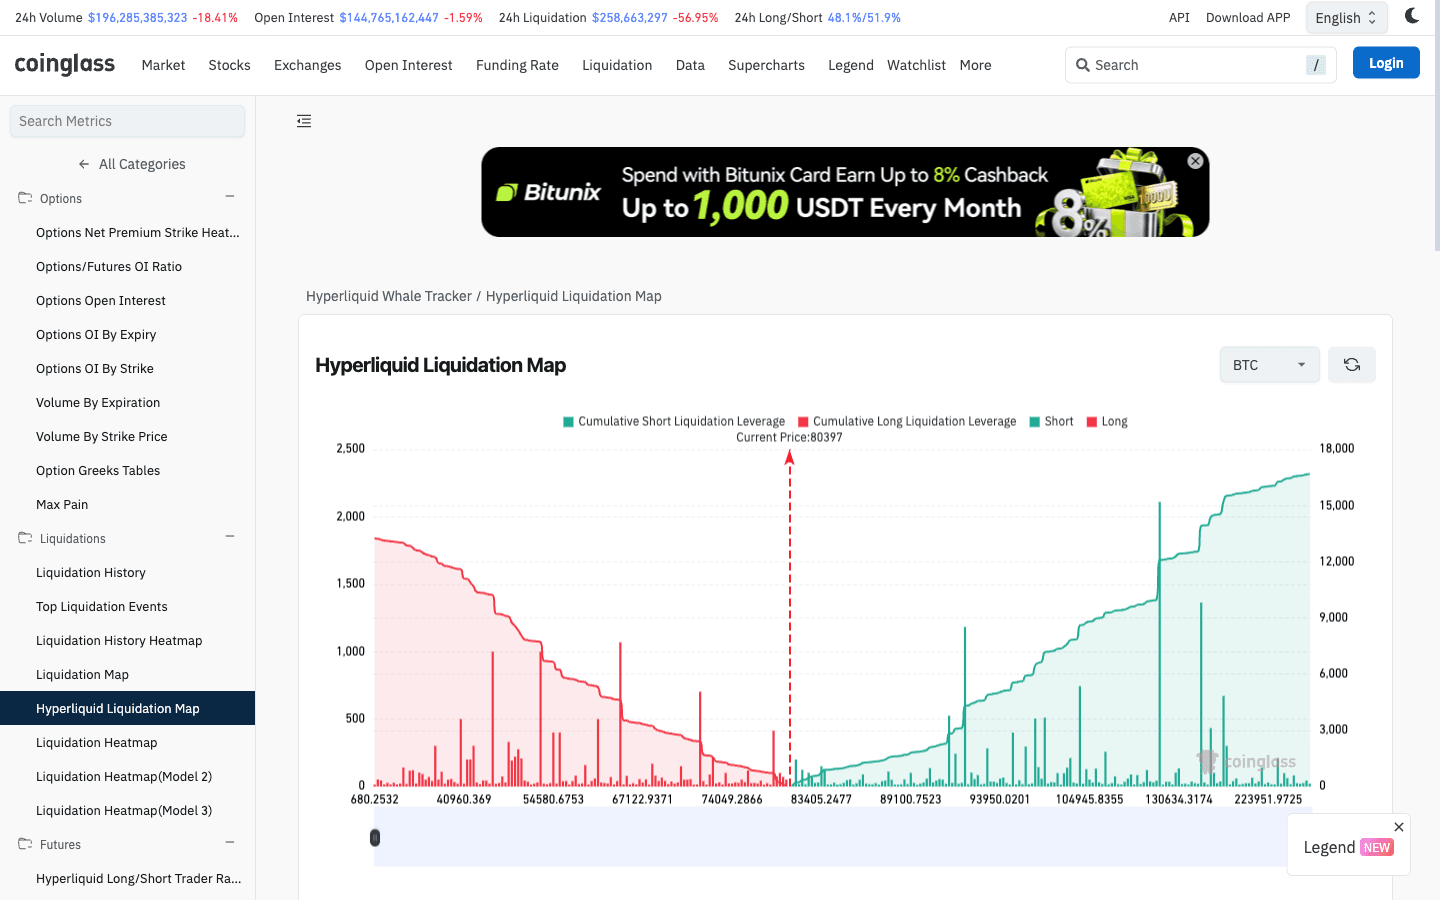
| CoinGlass Hyperliquid Liquidation Map | Whale positions over $1M: one bar per position plus cumulative long/short curves, per coin. Next to the CoinGlass Hyperliquid whale tracker. | Exact (whales only) | Free |
| HyperPerps liquidation heatmap | BTC, ETH, SOL and HYPE clusters built from about 21,000 wallets, with stop pools and take-profit walls; rebuilt about every 5 minutes; free public JSON API (it feeds the “today” table on this page). | Exact | Free, no signup |
| Hyperdash | Per-market list of top traders with each position’s entry and liquidation price, cohorts by size and PnL. Covers HIP-3 markets too. A list, not an aggregated map. | Exact (list) | Free |
| B. HYPE token heatmaps on Binance, Bybit and other CEXs (modelled) | |||
| CoinGlass Liquidation Heatmap (Model 1, 2, 3) | Predicted levels from market data and assumed leverage. HYPE/USDT on Binance by default; other exchanges and coins selectable. | Model | Free with limits |
| Coinfuty HYPE heatmap | Cross-exchange model (10x–100x leverage cohorts anchored to open interest) blended with real Hyperliquid whale positions; updates every minute; cascade simulator. | Model + whale layer | Free |
| Datawallet HYPE heatmap | Binance, Bybit or aggregated HYPE/USDT, 24h to 90d, with a key-levels list in % distance. | Model | Free |
| Coinperps HYPE heatmap | Switch between Binance, Bybit and Hyperliquid, 12h to 90d, with a “what liquidates if price moves ±1–5%” list; levels “refresh every few minutes”. | Model (CEX) / on-chain (Hyperliquid) | Free |
| CoinAnk Hyperliquid Liq Map | Per-pair Hyperliquid map of relative liquidation strength (bars are relative, not dollars), plus a liquidation heatmap. Japanese interface available. | Relative strength | Free account needed; VIP trial |
| The Kingfisher | LiqMap and heatmap terminal (snapshot, footprint, price × time) built on liquidation estimates. Premium $65/month and Pro $90/month billed yearly, or pay-as-you-go credits. | Model | Paid |
| C. Liquidations that already happened (history) | |||
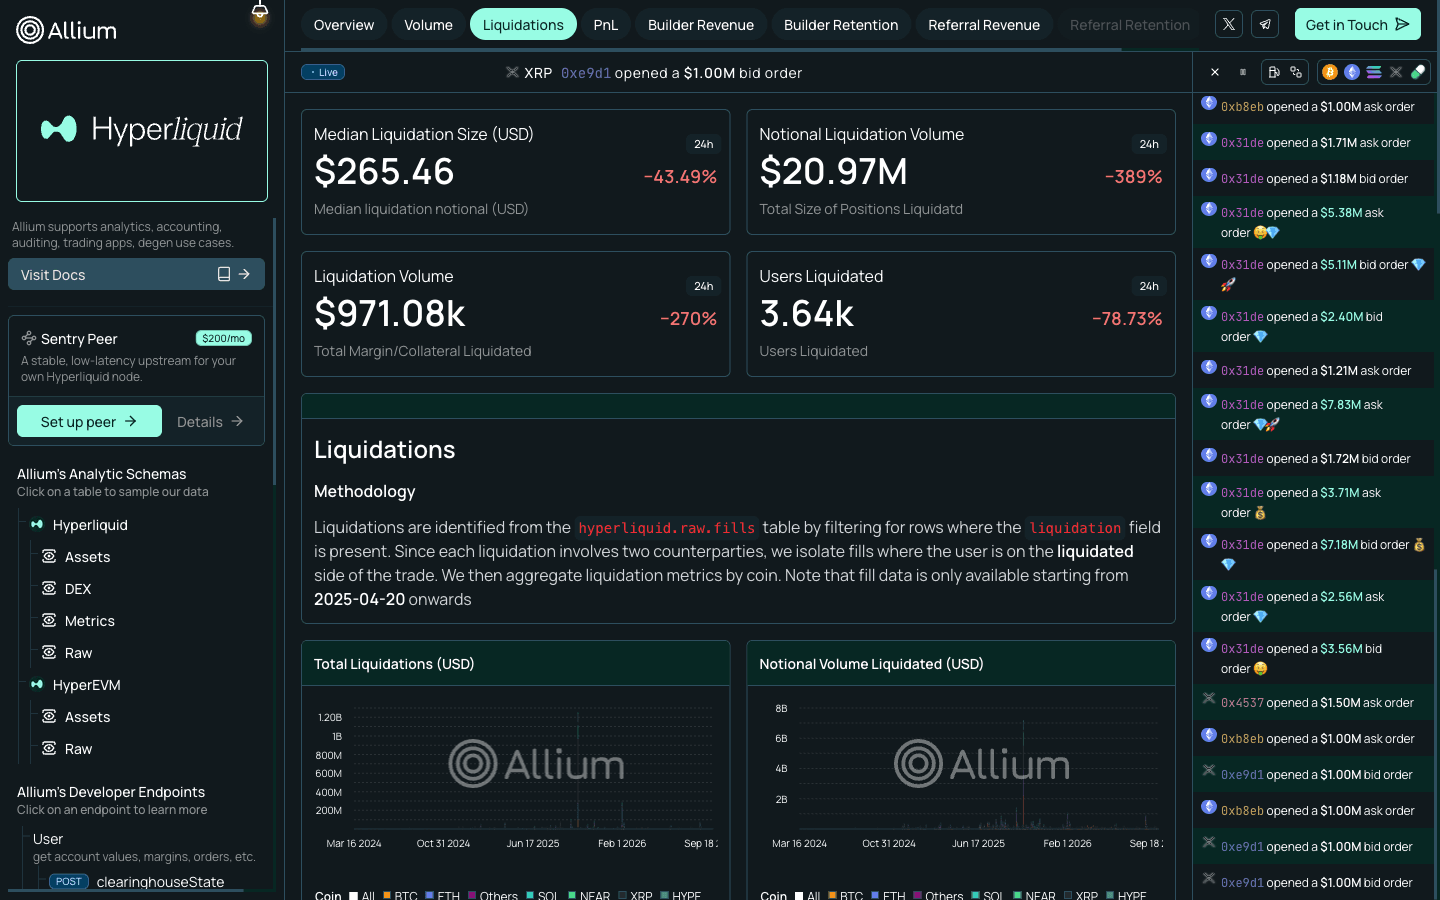
| Allium Hyperliquid dashboard | Realized Hyperliquid liquidations taken from fills: 24h median liquidation size, notional liquidated, users liquidated. | History (Hyperliquid) | Free |
| CoinGlass Liquidation History Heatmap | Number of liquidation trades per coin over 1h, 4h, 12h and 24h, with a 30-day heatmap. | History | Free |
| Coinalyze HYPE liquidations | HYPE token liquidations on centralized exchanges (Binance, OKX, Bybit and others), per exchange and aggregated. The chart is not real-time. | History (CEX) | Free |
| Gate HYPE liquidation data | HYPE liquidations over 1h, 4h and 24h by exchange, plus large liquidation orders. Japanese interface available. | History (CEX) | Free |
| HyperTracker Liquidations (CoinMarketMan) | Realized Hyperliquid liquidations over 1h, 4h, 12h, 24h and 30 days (longs vs shorts, positions affected, largest single liquidation), plus a “Large Positions at Risk” list of positions over $500,000 with a liquidation meter. The live feed needs a free login. | History + at-risk list (Hyperliquid) | Free; live feed with login |
| Your own level | |||
| Hyperliquid app and info API | The app shows your position’s liquidation price live. The API’s clearinghouseState returns liquidationPx for any address, so you can build your own map. | Exact | Free |
Which one to open
- Intraday BTC, ETH or HYPE trader: the CoinMarketCap map for the 60-second refresh and leverage-band colours, with the CoinMarketCap heatmap alongside to see which zones have held for a day or a week.
- Swing trader checking risk once a day: the CoinGlass Hyperliquid map plus the whale tracker next to it, so you can see who owns the biggest bars and how much margin they have.
- Altcoin trader: CoinMarketCap, because it covers every native Hyperliquid perp rather than whales or three majors.
- Trading HYPE on Binance or Bybit: a model heatmap (CoinGlass, Coinfuty, Datawallet), read together with the exact Hyperliquid map, because Hyperliquid is where most HYPE leverage sits.
- Systematic trader: the API or HyperPerps’ free endpoint. Details in section 5.
3. What a Hyperliquid liquidation map is, and why it is exact
A liquidation map answers one question: if price moves to level X, how much position value gets force-closed? Longs get forced out as price falls and shorts as it rises, so long bars stack under the market and short bars over it; the height of a bar is the dollar exposure that would be closed inside that band. The largest bars are the levels most likely to act as magnets, because anyone who pushes price into them releases a burst of forced market orders.
Centralized exchanges do not publish this data, so CoinGlass and others build heatmaps by modelling where leverage was probably applied from open interest, price changes and assumed leverage. On Hyperliquid the model is unnecessary. The exchange runs on its own chain, and one clearinghouseState request to the public info API returns any address’s open positions with size, leverage, margin mode and the exchange’s own liquidationPx. A Hyperliquid liquidation map is the real list of levels, aggregated. CoinMarketCap labels its version “Hyperliquid Exact” for that reason.
The catch is that exactness is a snapshot. A level is exact when you read it, but traders add margin, cut size or close, and cross-margin liquidation prices move whenever another position in the same account moves. A map from an hour ago can be wrong; a map from a minute ago is close enough to trade on.
Liquidation map vs liquidation heatmap
The two words get mixed up in search, but they are different views. A liquidation map is a bar chart of current levels by price. A liquidation heatmap adds time on the horizontal axis and shades each price band by how much is stacked there, so zones that persist stay bright and zones that were consumed go dark. For centralized exchanges a heatmap has to be a model. For Hyperliquid it no longer does: the CoinMarketCap Liquidation Heatmap, launched in September 2026, records the exact level of every open Hyperliquid position about every 5 minutes, and changing its range only zooms the chart. In practice: open the map to see which bands price would run into next, and the heatmap to judge whether those bands are old and persistent or were only just built.
Why a Binance HYPE heatmap still matters for Hyperliquid
Hyperliquid liquidates at the mark price, and one of the three inputs to the mark is the median of centralized-exchange perp prices from Binance (weight 3), OKX (2), Bybit (2), Gate (1) and MEXC (1), according to the official docs. The other two inputs come from Hyperliquid’s own book and the oracle. So a liquidation cascade through a dense HYPE cluster on Binance moves one input of Hyperliquid’s mark directly, and can drag Hyperliquid positions into their levels even before Hyperliquid’s own book moves. Model heatmaps for the CEX side and the exact Hyperliquid map are two halves of the same picture. More on how the mark is built in mark price vs index price.
4. How to read a Hyperliquid liquidation heatmap or map
The steps are the same for the bar-chart map and the time-by-price heatmap; the heatmap adds step 5, telling fresh clusters from swept ones.
- Pick the coin and find the price marker. Long liquidations sit below it, short liquidations above. On CoinMarketCap you can switch between the token aggregate and a single market.
- Find the largest bar on each side and measure its distance in percent. A $100M bar 5% away can be reached in one volatile session; a bigger one 60% away is positioning information, not a target. Distance matters more than size, and the “largest magnet zone” a tool highlights is often the farthest one.
- Check who is behind the bar. One position from one whale can be defended with more margin or closed early. Twenty positions from twenty accounts behave like a crowd and are far more likely to actually liquidate. The CoinGlass whale table (see our Hyperliquid whale tracker guide) and Hyperdash (Hyperdash guide) show the owners; CoinMarketCap’s leverage colours are a proxy, since high-leverage bands are dense with small accounts.
- Compare against open interest. A $100M cluster is a much bigger event on HYPE or SOL than on BTC. Our live markets table lists open interest per coin.
- Separate fresh clusters from swept ones. On a heatmap, a band that price has already run through and that went dark is spent: the forced orders have fired. A bright band that has persisted for a day or more and has not been touched is the live magnet.
- Watch the drift over 12–24 hours. Levels move as traders add margin, as funding changes account value and as new positions open. A cluster that keeps sliding away from price is being defended; one that keeps thickening is being crowded.
- Cross-check funding. Stretched positive funding plus a big long cluster just below price is the classic long-squeeze setup; stretched negative funding plus a short wall just above is the mirror. Live rates are in our Hyperliquid funding rate tables.
Different tools also sample different traders, which is why their pictures differ. HyperPerps reads about 21,000 wallets of every size; our snapshot reads only the largest accounts. On October 21, 2026 the two disagreed sharply: at 07:40 UTC HyperPerps’ heaviest BTC long cluster sat at $81,364 ($25.6M across 21 wallets, 2% below price) and it counted $152M of BTC longs within 5%, while the whale sample held $2M within 5%. On October 15 they had agreed (HyperPerps’ heaviest BTC long cluster then was at $79,505, in the same zone as three whale longs). Retail clusters near price and whale clusters farther out are both real; they answer different questions, so read both.
5. Hyperliquid liquidation data and history: API and alerts
“Hyperliquid liquidations” usually means what already happened, not what could. Hyperliquid has no market-wide liquidation stream or endpoint in its API: a liquidation is flagged in the liquidated account’s own fills, and the only complete record is the node fill archive on S3, so every history below is either one account at a time or a third party that collected all of them. Where to look:
- Exchange-wide history: Allium’s dashboard counts realized Hyperliquid liquidations from fills that carry a liquidation field (median size, notional, users liquidated). For the HYPE token on centralized exchanges, Coinalyze and Gate break liquidations down by exchange, and the CoinGlass Liquidation History Heatmap counts liquidation trades per coin.
- One account: paste the address into the Hyperliquid explorer or Hyperdash; liquidation fills are marked in the trade history.
- API:
clearinghouseStatereturns open positions withliquidationPx(weight 2 of a 1,200-per-minute budget; add"dex"for HIP-3 markets). Each fill inuserFillscan carry aliquidationobject with the liquidated user, the mark price and the method,market(sent to the book) orbackstop(taken by the liquidator vault). TheuserEventswebsocket pushes liquidation events as they happen. Setup and rate limits: Hyperliquid API guide. - Alerts and Telegram: third-party bots post large liquidations to Telegram, and CoinGlass has its own alert feature. We have not audited any of them. A price alert just before the cluster you watch, or a websocket subscription to the addresses you care about, does the same job with no middleman. See how to set up price and liquidation alerts.
Hyperliquid liquidation data: what you can pull yourself
Three questions come up in search, and each has a different source:
- “Hyperliquid liquidation history” for the whole exchange: the only official record is the node fill archive (
node_fills_by_blockon S3, requester pays), where each liquidation fill carries the liquidation field. Parsing it, and the other archives, is covered in our Hyperliquid historical data API guide. Allium offers the same data as ready-made tables. - “Hyperliquid liquidation data” for a list of accounts: query
userFillsByTimeper address and keep the fills whoseliquidation.liquidatedUseris that address. Page through the results (one response holds at most 2,000 fills; restart from the last fill’s time) and count failed requests instead of treating them as empty. That is how we checked the whale accounts tracked in section 1 for liquidation fills. - “Hyperliquid liquidation levels API”:
clearinghouseStateper address for exactliquidationPxvalues, or the HyperPerps endpoint for clusters already aggregated across about 21,000 wallets (it powers the table at the top of this page).
Worked example: what one sweep of large accounts found (October 4–15)
For the October 15 edition we ran that query for all 937 accounts in the whale snapshot, from October 4 (15:27 UTC) to October 15 (04:45 UTC), paging every response and with no failed request. Result: 55 liquidation fills worth $104.7M across 22 accounts. Two thirds was ETH: on October 8, as ETH fell through $2,440–2,417, Hyperliquid cut the two biggest ETH longs of the October 4 table in 20% slices. At 15:35 UTC it sent 11,372 ETH of a 56,861 ETH long to the book (filled at an average $2,438.55, $27.7M); at 16:02 it took a second 20% of the same position (9,098 ETH at $2,420.17) and the first 20% of a 41,228 ETH long (8,246 ETH at $2,417.69): $69.7M of forced market selling in 27 minutes, each slice exactly 20% of the position as the docs describe. HIP-3 stock perps added $32.4M (xyz:INTC $9.35M, xyz:SKHX $8.56M, xyz:LITE $7.35M, xyz:SOXL $4.90M and smaller ones) and a HYPE long $1.9M. All 55 fills went to the order book (method market), none to the backstop vault. Both ETH accounts were refilled with fresh USDC within the hour and bought back; they are the two ETH longs defended again this week. The sample covers large accounts only, so it is a method demonstration, not an exchange total.
6. How Hyperliquid liquidations execute
Reading the map well requires knowing what happens when a level is hit, because the mechanism decides whether a cluster becomes a cascade. From the official liquidation docs, read on October 21, 2026:
- Trigger. A position is liquidatable when account equity falls below the maintenance margin, which is half the initial margin at the asset’s maximum leverage (table in section 7). Large positions fall into lower leverage tiers and therefore face higher maintenance.
- Price used. The mark price, which combines external CEX prices with Hyperliquid’s own book and updates about every 3 seconds (how it is built: Hyperliquid mark price vs index price). Printing one bad trade on Hyperliquid’s book is not enough to trigger a cluster.
- Execution. The position is sent to the order book as market orders. For positions over 100,000 USDC only 20% is sent at first; after a partial liquidation there is a 30-second cooldown during which further liquidation orders are for the whole position. Collateral left once maintenance is met stays with the trader, and there is no clearance fee.
- Backstop. If equity drops below two-thirds of maintenance margin without a successful book liquidation, the liquidator vault, a strategy inside HLP, takes the position, and the maintenance margin is not returned. For cross positions, all cross positions and cross margin transfer together.
- Auto-deleveraging. If an account ends up with negative value, profitable traders on the other side are ranked by unrealized PnL and leverage and closed at the previous mark price, so the exchange carries no bad debt. A lopsided map, with a huge short cluster above and almost nothing below, is where ADL risk concentrates for the winning side if that cluster ever breaks.
The consequence for the map: every level that gets hit becomes taker flow on Hyperliquid’s book in the direction of the move. Slicing large positions and a blended mark price slow cascades compared with venues that liquidate whole positions at their own last price, but they do not stop them. A cluster that is large next to visible book depth will still walk the mark into the next cluster. That feedback loop is covered in how liquidation cascades form.
7. Estimate your liquidation price, and leverage caps
Before trading around other people’s levels, know your own. This quick estimate uses Hyperliquid’s published formula for an isolated position (for both sides, cross margin and other venues, open the liquidation price tool); for cross margin, the liquidation price depends on total account value instead. For every Hyperliquid perp with margin tiers, cross margin, fees, funding and PnL, use the full calculator; the derivation and other venues are in the DEX liquidation price calculator.
Hyperliquid Calculator — One Hyperliquid position end to end: margin, liquidation price, fees, hourly funding, PnL and ROE for every perp market. — Open the calculator →Liquidation price: $70,518.99 (8.86% from entry, maintenance 1.25%)
Uses liq = entry × (1 − side × (1/leverage − m) / (1 − side × m)), with m the maintenance margin rate. Ignores fees and funding, which move the real level slightly.
How leverage caps set how far clusters sit from price: the higher an asset’s maximum leverage, the closer to price its most aggressive positions liquidate. Maximum leverage and margin tiers from the registry, maintenance margin derived from the docs rule:
| Asset | Max leverage | Maintenance margin | Long liquidates at max leverage | Large-position tier |
|---|---|---|---|---|
| BTC | 40x | 1.25% | −1.27% | 20x above $150M |
| ETH | 25x | 2% | −2.04% | 15x above $100M |
| SOL | 20x | 2.5% | −2.56% | 10x above $70M |
| XRP | 20x | 2.5% | −2.56% | 10x above $40M |
| HYPE | 10x | 5% | −5.26% | 5x above $20M |
Distance from entry to liquidation for an isolated long:
| Isolated leverage | BTC | ETH | SOL | HYPE |
|---|---|---|---|---|
| 3x | 32.49% | 31.97% | 31.62% | 29.82% |
| 5x | 18.99% | 18.37% | 17.95% | 15.79% |
| 10x | 8.86% | 8.16% | 7.69% | 5.26% |
| 20x | 3.80% | 3.06% | 2.56% | — |
| 25x | 2.78% | 2.04% | — | — |
| 40x | 1.27% | — | — | — |
Worked example with the snapshot price: a 10x isolated BTC long at $82,781 liquidates at about $75,446, just above the 805 BTC isolated whale long near $74,780, so in a fall you would be force-sold first, and the whale’s 20% slices would follow straight after. At 20x the same entry liquidates at $79,637, 3.8% under the mark and only 0.1% below BTC’s low since October 15 of $79,732, so one slightly wider day would take you out. It also sits inside the 5% band where HyperPerps counted $152M of smaller traders’ BTC longs at 07:40 UTC on October 21, 2026, with its heaviest cluster above you at $81,364 (section 4): if that crowd is forced out first, its market selling pushes the mark toward your level. Putting your liquidation price inside or just beyond a big cluster is the most avoidable mistake on the map. Two rules: keep your level clear of the nearest large cluster, and set a stop above your liquidation price so you keep the maintenance margin instead of handing it to the backstop. Related: Hyperliquid isolated vs cross margin, leverage tiers across DEXs.
See your liquidation price before you trade
Join Hyperliquid with code HOLYGRAIL for 4% off fees on your first $25M of volume. Isolated or cross margin, a live liquidation price on every position, no clearance fee on liquidations. Enter the code before you pass $10,000 of volume.
Already have a Hyperliquid account? While it has traded no more than $10,000 in total, you can still add a code in the app under Referrals → “Enter Code” (Hyperliquid referral code after you have traded).
8. Trading around Hyperliquid liquidation clusters
Setups that use the map
- Fade the flush. When price is driven into a large long cluster, the forced selling is mechanical and finite. Wait for the cluster to clear (the bars disappear and the heatmap band goes dark), then look for a long on the reversal with a stop below the wick. Buy after the cluster is gone, not into it.
- Ride the magnet. If a large cluster of many accounts sits within 3–5% and the market is already moving toward it, trade in the direction of the move with a take-profit just before the cluster. This does not need the cluster to break or a reversal call.
- Never park a stop inside a cluster. Your stop becomes one more market order in the same burst and fills at the worst prices. Put it before the cluster or well beyond it.
- Size against the map. If your liquidation level would land inside a dense cluster, lower the leverage until it does not. The map is a leverage selector as much as a signal.
- Use funding as the filter. A long cluster below price matters most when funding is stretched positive (longs crowded and paying); a short wall above matters most when funding is deeply negative.
What not to do
- Do not treat every bar as a target. Most levels are never hit. Bars far from price describe positioning, not trades.
- Do not ignore who owns the bar. A single whale with free margin can defend a level, but not always in time: in October one sending address funded three whale positions, and the two ETH longs among them still lost 20% slices to liquidation when ETH fell fast on October 8, then were refilled. As the September 20 snapshot showed, a whale can also simply leave.
- Do not forget the map is public. Every market maker sees the same clusters. The edge is in combining the map with funding, open interest and your own limits, not in the map alone.
- Do not use a CEX heatmap as Hyperliquid data. Binance moves feed Hyperliquid’s mark price, but the levels that create forced flow on Hyperliquid’s book are Hyperliquid’s own.
Trade the map on the exchange that publishes it
Open Hyperliquid with code HOLYGRAIL: 4% off trading fees for your first $25M of volume. New to the venue? Start with how to use Hyperliquid and the fee schedule.
FAQ
What is the Hyperliquid liquidation map?
It is a price ladder that adds up, band by band, how much open leveraged exposure on Hyperliquid would be force-closed if the mark reached that band. Longs are forced out on the way down, so their bands are under the market; shorts are forced out on the way up. Hyperliquid’s positions and their liquidation prices are public chain data, so the ladder is built from real levels, while maps for centralized exchanges have to guess them.
Where can I see a Hyperliquid liquidation heatmap for free?
For exact Hyperliquid data: the CoinMarketCap Liquidation Heatmap (new in September 2026, levels read from the chain about every 5 minutes), the CoinMarketCap Liquidation Map (refreshed every 60 seconds), the CoinGlass Hyperliquid Liquidation Map (whale positions over $1M) and HyperPerps (BTC, ETH, SOL and HYPE). For the HYPE token on Binance and Bybit: the CoinGlass Liquidation Heatmap, Coinfuty, Datawallet and Coinperps, which are models. 15 of the 16 tools we checked were free on October 21, 2026; The Kingfisher is the paid option.
What is the difference between a liquidation map and a liquidation heatmap?
A map is one moment: liquidation value per price band right now, drawn as bars. A heatmap is the same measurement repeated over time, with time running left to right and colour intensity showing how much sits in each band, so you can tell zones that held for days from zones price already ran through. Most heatmaps for centralized exchanges are models built from open interest and assumed leverage. On Hyperliquid both can be exact, because the levels come from the chain.
Is the Hyperliquid liquidation map accurate?
The levels are exact at the moment they are read, because they come from the liquidationPx field the exchange computes for each position. What is not guaranteed is that a level gets hit or even survives: traders add margin, cut size or close, and cross-margin liquidation prices move with the rest of the account. Treat the map as a snapshot to re-read, not a fixed list of targets.
How much was liquidated on Hyperliquid today?
Hyperliquid itself has no market-wide liquidation stream or endpoint in its API: a liquidation is flagged in the liquidated account’s own fills, and the only complete record is the node fill archive on S3, so a market-wide 24-hour total always comes from a third party that has collected every account's fills: Allium's Hyperliquid dashboard, or the exchange tables on CoinGlass's liquidation page. What this page measures instead is what would liquidate next: at October 15, 2026, 04:41 UTC, a 5% drop would have liquidated $257.1M of BTC longs, $260.9M of ETH longs, $12.6M of HYPE longs, $24.3M of SOL longs, and a 5% rise $61.1M of BTC shorts, $28.9M of ETH shorts, $0 of HYPE shorts, $1.4M of SOL shorts (HyperPerps sample). In the 24 hours to about 07:10 UTC on October 21, 2026, Allium and HyperTracker both counted $44.1M liquidated across 3,823 traders, most of it shorts.
Where can I see Hyperliquid liquidation history?
For liquidations on Hyperliquid itself, Allium’s public dashboard shows realized liquidations taken from fills (median size, notional, users liquidated). For HYPE token liquidations on centralized exchanges, use Coinalyze, Gate or the CoinGlass Liquidation History Heatmap. For a single account, the Hyperliquid explorer and the userFills API mark every liquidation fill. For the full history of every account, the only official source is the node fill archive on S3, which you parse for the liquidation field; our Hyperliquid historical data API guide shows how.
Where can I download Hyperliquid liquidation data?
There is no ready-made liquidation file. The official options are per account (userFills, userFillsByTime and userNonFundingLedgerUpdates over the free info API) or the requester-pays node_fills_by_block archive on S3 for every account. Allium offers the same data as SQL tables. For current levels rather than history, clearinghouseState returns each open position with its liquidationPx, and HyperPerps publishes aggregated clusters as free JSON.
Is there a Hyperliquid liquidation API?
Yes, the public info API is free. clearinghouseState returns any address’s positions with liquidationPx (weight 2 against a budget of 1,200 per minute), and passing a dex name returns HIP-3 positions. Fills carry a liquidation object with the liquidated user, the mark price and the method (market or backstop), and the userEvents websocket pushes liquidation events. HyperPerps also publishes a free heatmap endpoint for BTC, ETH, SOL and HYPE. Market-wide liquidation history is not in the info API; it comes from the node fill archive on S3.
Is there a Hyperliquid liquidation Telegram bot or alert?
Several third-party Telegram bots post large Hyperliquid liquidations, and CoinGlass offers alerts, but we have not audited any of them and they are not needed to read the map. The dependable option is to subscribe to the official websocket for the addresses you care about, or to set a price alert just before the cluster you are watching.
Is there a liquidation heatmap for gold on Hyperliquid?
Not as a full map in the tools we checked. Gold trades on Hyperliquid as the HIP-3 market xyz:GOLD (up to 25x on October 21, 2026), and the CoinMarketCap map covers native Hyperliquid perps only, which includes the tokenised-gold perp PAXG but not xyz:GOLD. Hyperdash lists each xyz:GOLD trader’s liquidation price, and the API returns HIP-3 positions when you pass the dex name, so you can build the map yourself.
Where can I find a crypto liquidation heatmap?
CoinMarketCap and CoinGlass have the best-known free ones, with CoinAnk, Coinfuty, Datawallet and Coinperps as alternatives. Check which data each one uses: only maps built from Hyperliquid’s on-chain positions show real levels. Heatmaps for Binance, Bybit or OKX are models of where leverage probably sits.
How do I calculate my own liquidation price on Hyperliquid?
The exact formula is liq_price = price − side × margin_available / position_size / (1 − l × side), where l is 1 divided by the maintenance leverage, side is +1 for longs and −1 for shorts, and margin_available is isolated margin (or cross account value) minus the maintenance margin required. For an isolated BTC long the distance to liquidation is about 8.86% at 10x and 3.80% at 20x. For cross positions it depends on total account value, not the leverage slider. The estimate on this page, our Hyperliquid calculator (every perp, cross margin, fees and funding) and the DEX liquidation price guide walk through it.
Can a liquidation heatmap predict price?
No. It shows where forced orders would start if price gets there, not whether it will. Clusters work as magnets mainly when funding is stretched in the same direction and the move is already under way. Many levels are never reached, and single-whale clusters often disappear because the owner closes or adds margin first.
Disclosure: HOLYGRAIL is our referral code; we earn a share of referred accounts’ fees. None of the tool links are affiliate links. Liquidation clusters were computed from public Hyperliquid API data at October 21, 2026 (07:00 UTC) and change constantly; the near-price heatmap comes from the HyperPerps public API at build time; tool features and prices were read on each tool’s site (October 21, 2026) and liquidation mechanics from the official Hyperliquid docs on October 21, 2026. Nothing here is investment advice.